

VBT Series Part 4: Strength Training with Velocity Data
The three-zone VBT system and takeaways from rowing and erging research

Part 3: How I introduced and began to use VBT with the GRP teams.
We’ll continue here in Part 4 with details of the three-zone VBT system and research and findings from rowing and erging data.
Remember our situation of not always being able to train with VBT. Athletes travel and train elsewhere regularly throughout the year, and we’re assuming no access to VBT during these times away. My goal in the initial months was for athletes to learn what the main three velocity zones feel like so that they could find them again without the technology. Here are the zones.
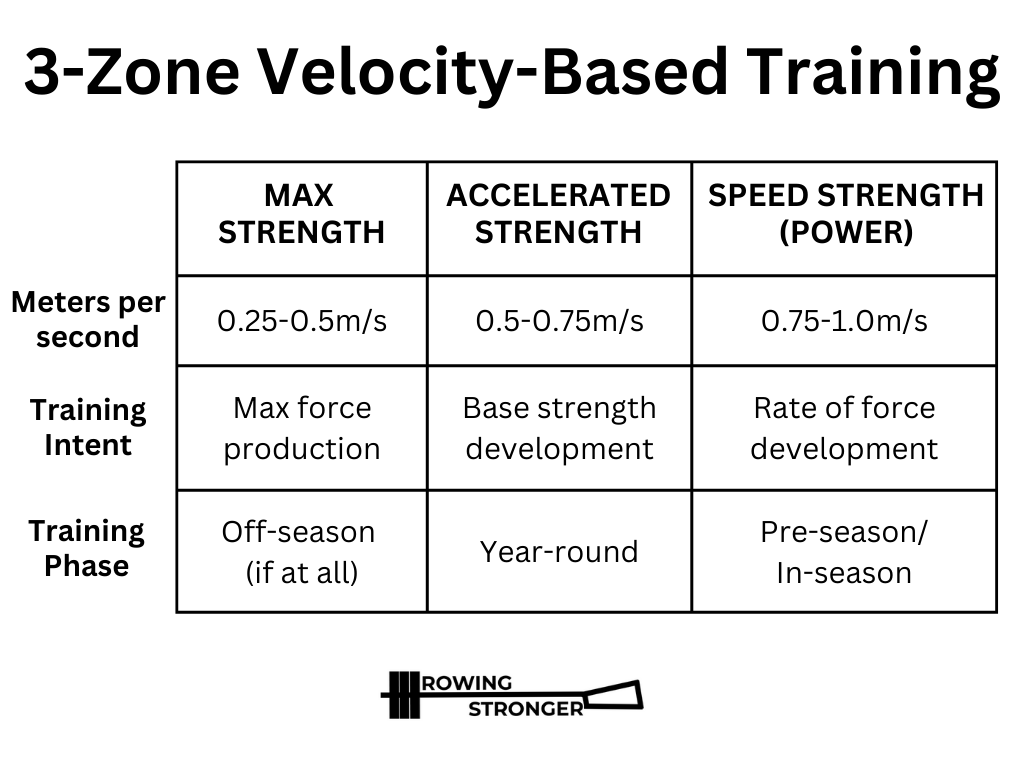
The exact wording of the different zones isn’t consistent across VBT resources, and some coaches get more detailed with the zones beyond the 0.25m/s range. This is just what I use in my coaching and what I think is a good, accessible starting point for VBT.
Max strength: We occasionally intentionally strength train below 0.5m/s, such as when working up to a 2-5-rep max. These reps might feel like RPE9-10, or max effort with one or no reps left in reserve. This slow, grinding speed of true max strength is not that beneficial or relevant for the fast force outputs of power-endurance sports like rowing and skiing, compared to the prior two zones. However, there’s a time and place in the program to “go heavy,” for athletes who need that big max strength stimulus. I mostly want them to know what this feels like so that we can avoid it and stay in the accelerated strength zone instead.
Accelerated strength: Most of our main work strength training is in the 0.5-0.75m/s range, so this is our base strength zone. We typically train this range for 3-5 sets of 4-8 reps with a 2:1 lowering-to-lifting tempo. We look at this as all reps in zone (usually faster at the start and slower at the end of the set) and/or as an average across the whole set. Before VBT, I wrote this as “RPE7-8,” training to within 2-3 reps of technical failure. RPE doesn’t transfer exactly, and most athletes can do at least 5-6 more reps going below accelerated strength into max strength before technique really starts to break down.
Speed strength/Power: When we want to train rate of force development, we bring the velocity range up to 0.75-1.0m/s and do 5-8 sets of 2-4 reps for power. We usually look for all reps to be over 0.75m/s, rather than the whole-set average. Many athletes struggled with this, even when using a weight significantly lower than their standard working weight. Before VBT, I wrote this as “full explosive intent” strength training. However, our 0.75m/s weights are significantly lighter than what we were using before going by feel of “full explosive intent.” This makes me question whether we were actually training power without the velocity data, or if it was more just accelerated strength.
Many athletes initially wanted to train more in the max strength zone, or gravitated to the lower boundaries of the accelerated strength zone and didn’t understand why pushing the lifting phase tempo faster is helpful for improving rowing performance. This is the “RPE 10/10” problem from the last part of this series. Endurance athletes CAN continue doing reps under very high fatigue, so they tend to want to continue even when lifting speed drops and movement quality declines. This is not necessarily or even usually productive for training, and VBT offers a way to quantify how and why.
Rowing and Erging Research
We have one great piece of rowing research to illustrate why slow force development isn’t that helpful for rowers: “Technical Determinants of On-Water Rowing Performance (2020).” I’ve written about this article’s takeaways before in “Rowing Peak Power Training.”
The main takeaway for VBT purposes is that the researchers found that peak force and time to achieve peak force were critical factors in boat speed in the men’s and women’s single and pair events. Time from blade entry to peak force was 0.43s in the men’s single, 0.39s in the women’s single, and 0.36s in the men’s and women’s pairs. We’d expect this to be even faster in faster moving team boats like eights and quads. I relate this study to the speed of lower body strength training movements: We need to hit peak force in less than a half-second to transfer to sport performance, or we’re training ourselves to be slow.
The researchers conclude that, “Rower force development should be prioritized as a key component of power output and boat velocity.” Force development has two main factors: total force and rate of force development. Total force is what people commonly refer to as strength: how much force you can produce regardless of time. Rate of force development is power, adding the time component: how much force you can produce divided by how much time it takes to produce force.
Total force and rate of force development are related and both important. Strength training can and should address both, and VBT offers a way to quantify and verify which quality we’re training when. Total force training in the 0.5-0.75m/s accelerated strength zone and the 0.25-0.5m/s max strength zones, and rate of force development training with the 0.75-1.0m/s power zone.
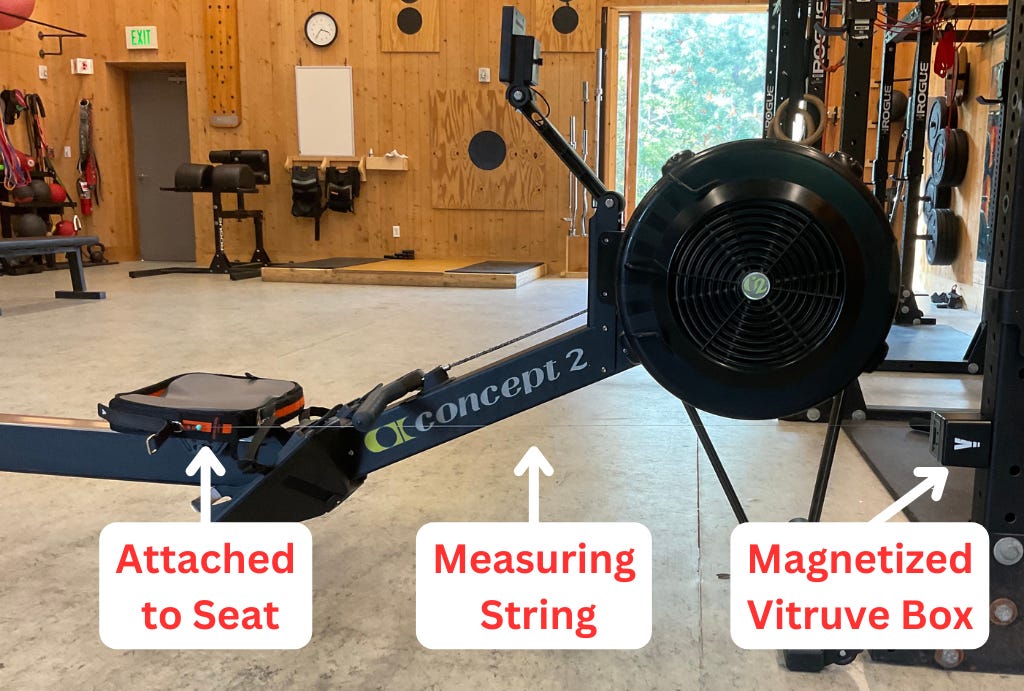
I also used the VBT unit in an erg test for my own anecdotal exploration of connecting velocity data in the erg’s simplified rowing performance environment. I turned the magnetized Vitruve box sideways, attached it to a power rack, and attached the measuring unit to the seat for a measurement of lower body speed.
I did 15 strokes at full slide from a dead start up to my hypothetical race pace (~35spm rate and ~1:35/500m speed). This replicates the slowest speed and highest force in a race, starting from a position of no momentum, up to the fastest speed before any fatigue accumulates. Below is the data readout. The left-most column is the important one, displaying mean velocity of each stroke. Next to that is peak velocity, then watts (which is a function of the weight, which I just arbitrarily entered for erging), then range-of-motion in inches, then estimated 1RM (also irrelevant for erging).
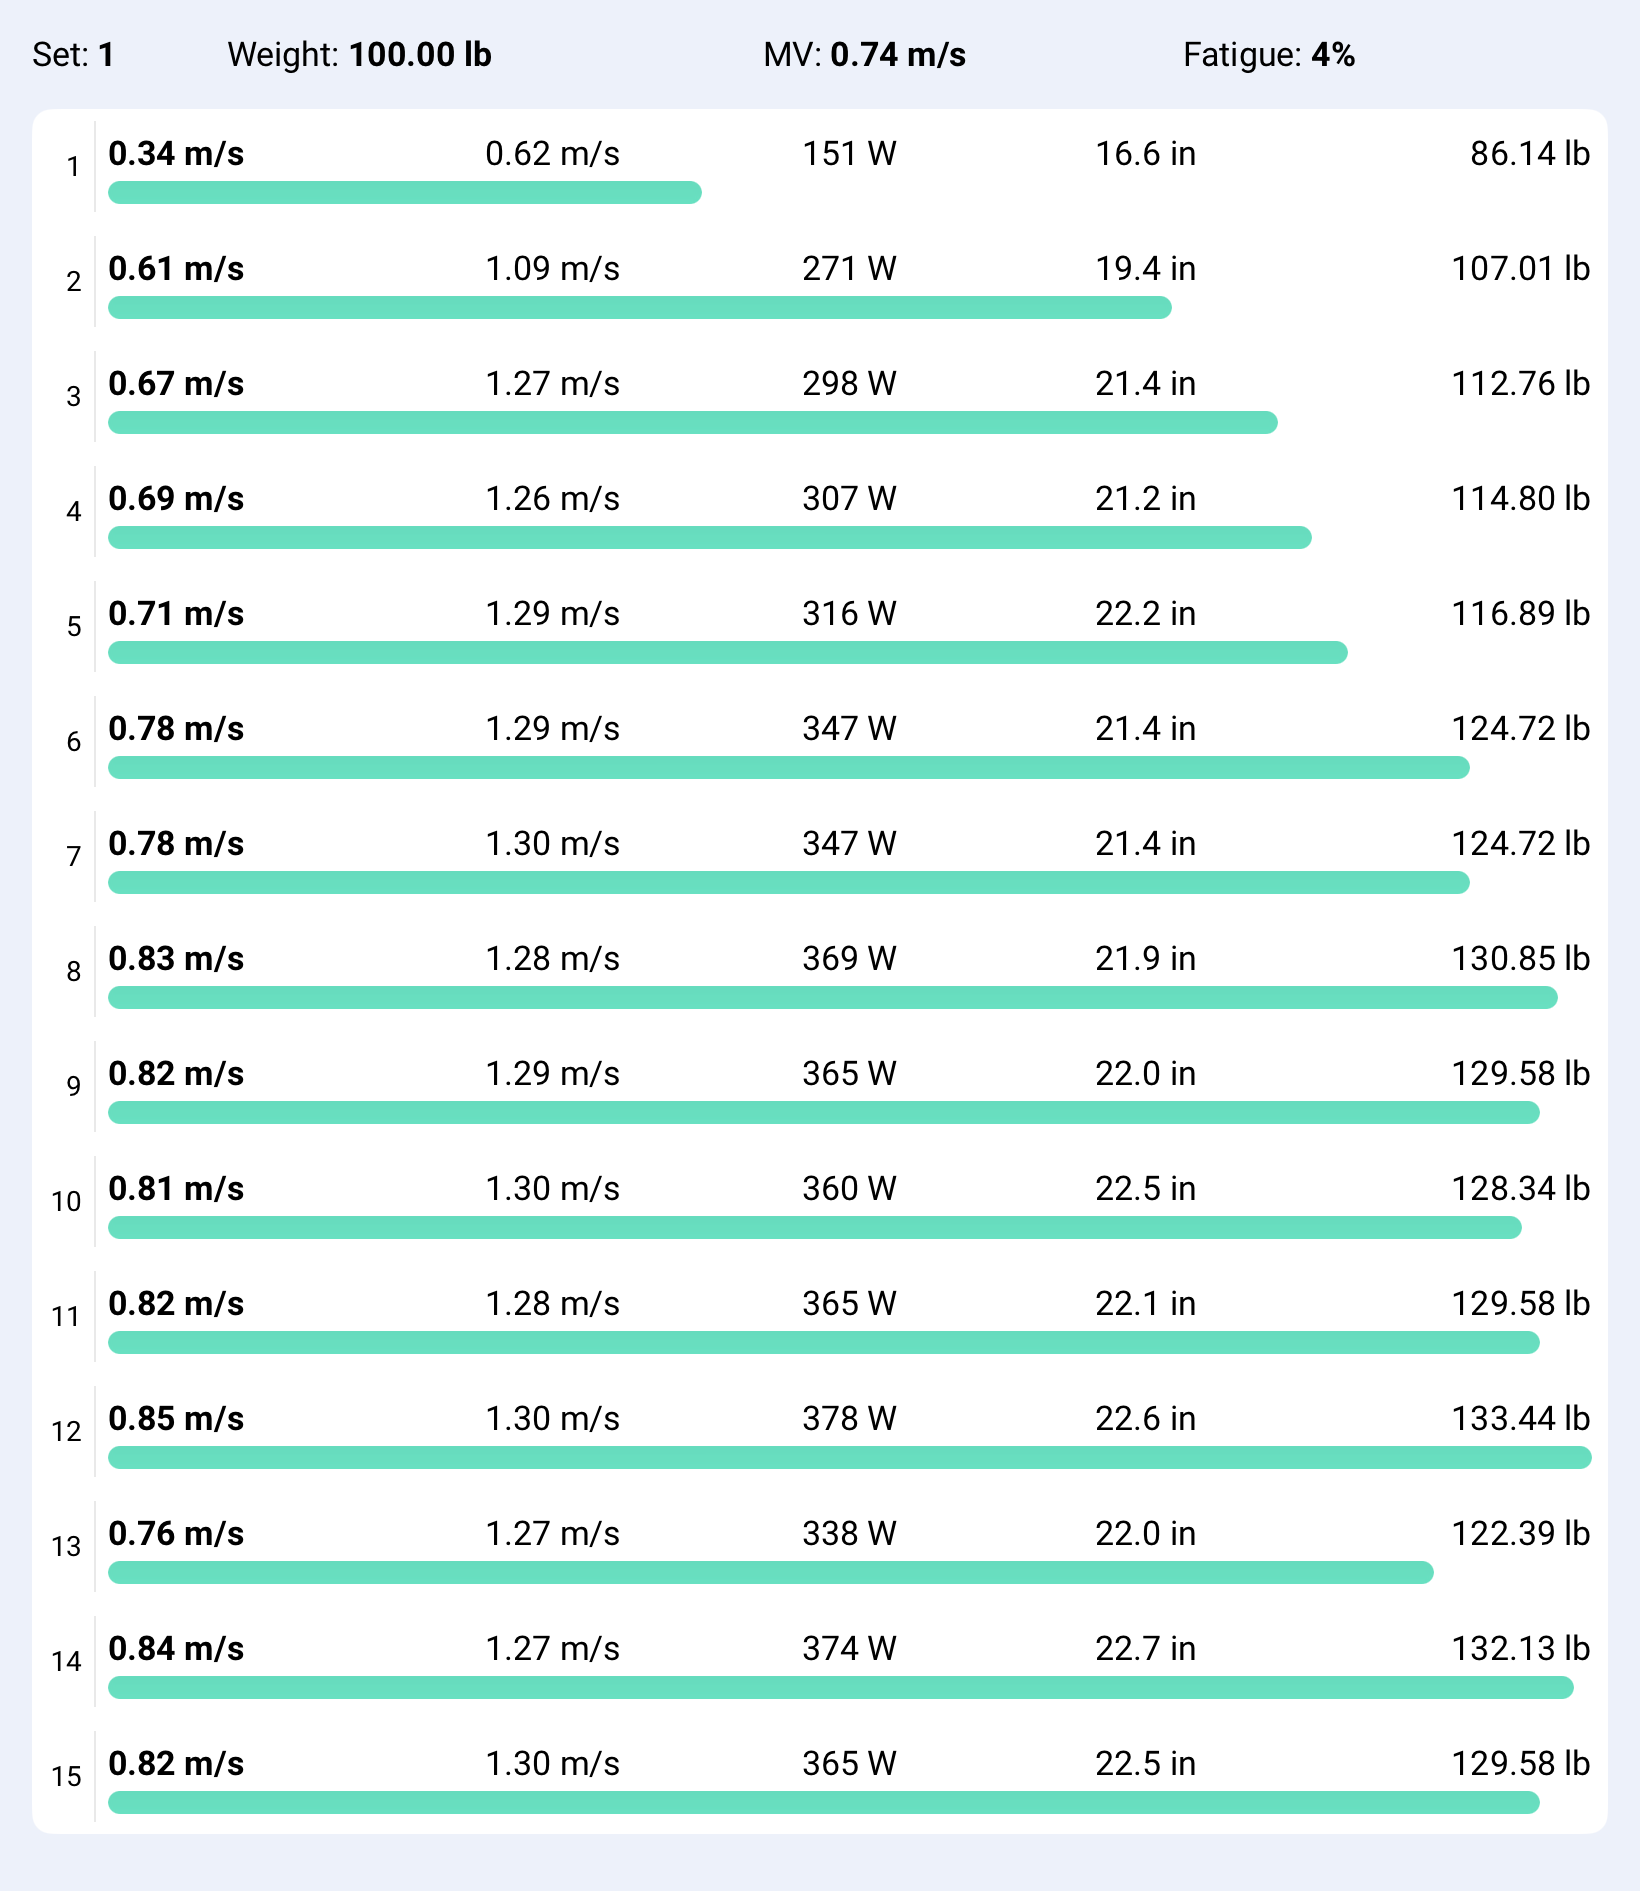
You can watch this here on Youtube, too, if it makes more sense seeing the data in real time. The first stroke from full slide (or nearly so, as we can see from the “ROM” column) and a dead start was 0.34m/s. This is the VBT max strength zone. The second stroke is 0.61m/s, into the VBT accelerated strength zone where it stays for strokes #2-5. Seat velocity leveled off around stroke #6 between 0.75-0.85m/s, which is the bottom of the VBT power zone. We wouldn’t expect seat speed to change much once we’re up to our base pace and rate.
I tested it out on the handle as well, and that continued to climb past 1.0m/s due to the longer range of motion and greater acceleration than the seat. I care about seat velocity more as a representation of lower body movement through knee extension. When we do squats and deadlifts, this is what we’re really training. This adds data to the rationale for doing most of our lower body (squat and deadlift) strength training in the 0.5-0.75m/s and power training in the 0.75-1.0m/s zones. We can individualize this further, if some rowers want to be on the higher side of the zone for a team boat focus and quicker acceleration, or the lower side for a small boat focus with slightly slower acceleration.
In Part 5, we’ll get more specific again with some actual strength training program snapshots, plus video demonstrations of what these different zones look like in the squat and deadlift.
Further, the big swing finish to increase total ark of movement is likely inferior to the flexed spine position as the height of the athlete increases and more particularly in stroke rates at or above 32/min. See Ollie, Drysdale, Tufte, Cappinen, Florein, and Karsten. The exceptions are shorter ala Ntouskos.
While I share the idea that strength improvement on dry land via various squats, modified dead lifts and other movements under tension with a straight back are important in generating power early in the rowing stroke cycle, note that the highest level men and women single scullers over several decades begin the drive phase of the stroke in a flexed spine position which is maintained approximately intact for roughly 80% of drive. In fact, current (2023) Dutch scullers dominating World Cup level competition, are releasing their blades about 15-18 degrees past vertical while still maintaining a slight bow or flex it the spine.
None of the lifts you prescribe begin in this posture and are in fact emphasize back extension well past the point where sculls are out of the water. Why is that?